Generates mask from a Seurat object. Requires SeuratObject package.
Source: R/generateMaskSeurat.R
generateMaskSeurat.RdGenerates mask from a Seurat object. Requires SeuratObject package.
Usage
generateMaskSeurat(
  object,
  reduction = NULL,
  group.by = NULL,
  gridSize = 200,
  expand = 0.005,
  minSize = 10
)
Arguments
- object
Seurat object
- reduction
character vector specifying which reduction to use (default:
DefaultDimReduc(object))- group.by
character vector specifying which field to use for clusters (default:
"ident")- gridSize
target width and height of the raster used internally
- expand
distance used to expand borders, represented as a fraction of sqrt(width*height). Default: 1/200.
- minSize
Groups of less than
minSizepoints are ignored, unless it is the only group for a cluster
Value
data.table with points representing the mask borders.
Each individual border line corresponds to a single level of group column.
Cluster assignment is in cluster column.
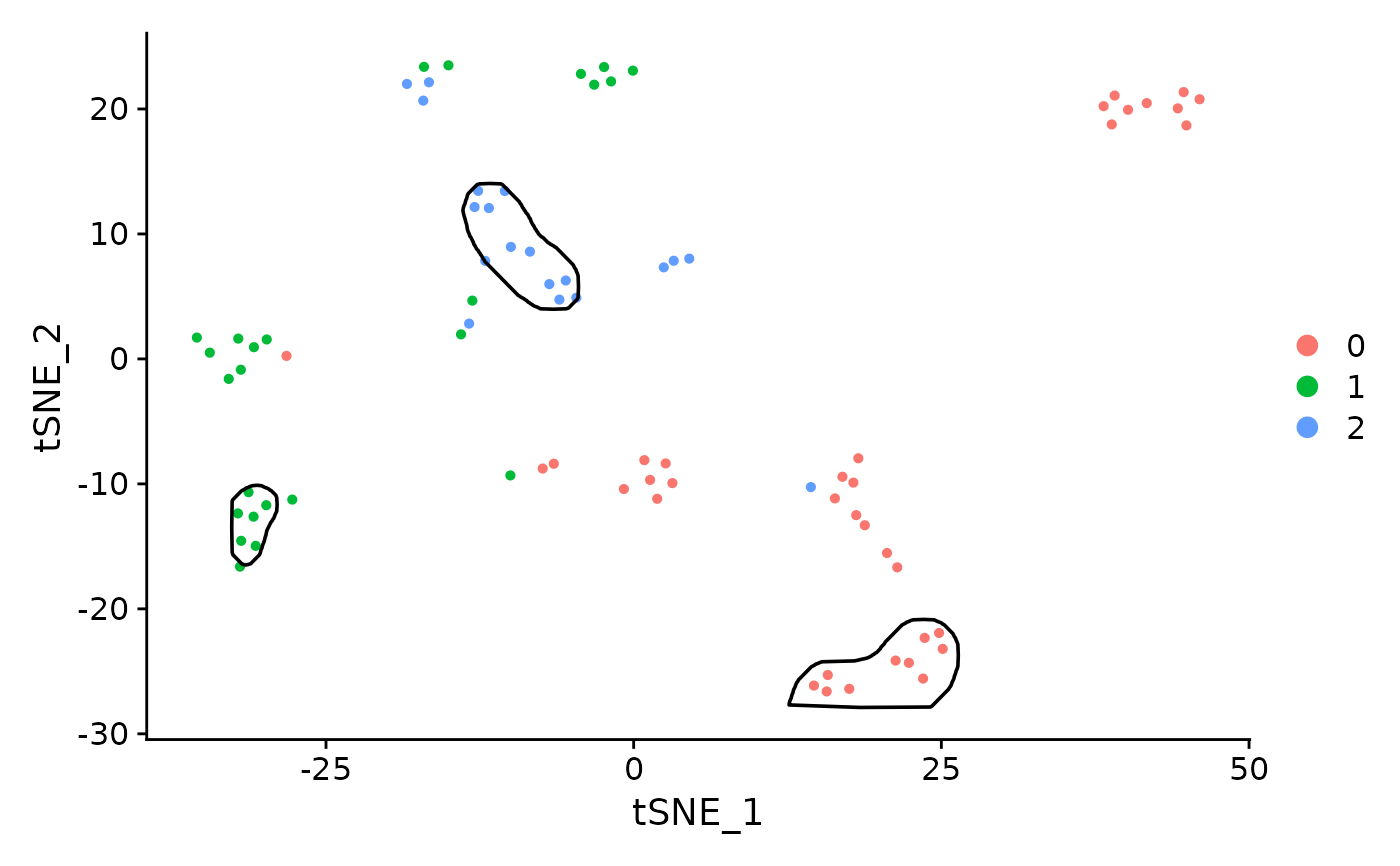
Examples
# only run if Seurat is installed
if (require("Seurat")) {
    data("pbmc_small")
    maskTable <- generateMaskSeurat(pbmc_small)

    library(ggplot2)
    # not the best plot, see vignettes for better examples
    DimPlot(pbmc_small) +
        geom_path(data=maskTable, aes(x=tSNE_1, y=tSNE_2, group=group))
}
#> Loading required package: Seurat
#> Loading required package: SeuratObject
#> Loading required package: sp
#> ‘SeuratObject’ was built under R 4.6.0 but the current version is
#> 4.6.1; it is recomended that you reinstall ‘SeuratObject’ as the ABI
#> for R may have changed
#>
#> Attaching package: ‘SeuratObject’
#> The following objects are masked from ‘package:base’:
#>
#>     intersect, t