Convenience helper that returns a list of ggplot2 components
that draws polygon-like outlines and
places cluster labels.
The plotting limits are expanded (via limits.expand) to provide
extra room for labels.
Usage
fancyMask(
  maskTable,
  ratio = NULL,
  limits.expand = ifelse(label, 0.1, 0.05),
  linewidth = 1,
  shape.expand = linewidth * unit(-1, "pt"),
  cols = "auto",
  label = TRUE,
  label.largest = TRUE,
  label.fontsize = 10,
  label.buffer = unit(0, "cm"),
  label.fontface = "plain",
  label.margin = margin(2, 2, 2, 2, "pt"),
  simp_ratio = 0.001
)
Arguments
- maskTable
A data.frame of mask coordinates. The first two columns are interpreted as x/y coordinates (in that order). Must contain at least the columns
cluster(a factor) andgroup(grouping identifier passed togeom_mark_shape()).- ratio
Optional aspect ratio passed to
ggplot2::coord_cartesian(). Use1for equal scaling. Default isNULL(no fixed ratio).- limits.expand
Numeric scalar giving the fraction of the x/y range to expand on both sides when setting plot limits. Default is
0.1with labels and 0.05 with no labels.- linewidth
Line width passed to
geom_mark_shape()for the outline. Default is1.- shape.expand
Expansion or contraction applied to the marked shapes, passed to
geom_mark_shape(expand = ...). Default isunit(-linewidth, "pt").- cols
Color specification for cluster outlines (and labels). One of:
"auto"(default) — inspects the plot at the timefancyMask()is added with+. If a layer mapscolourto a discrete (non-numeric) variable, the mask joins that scale viaaes(colour = cluster)so colours stay in sync regardless ofscale_color_*()order. Otherwise (continuous colour, constant colour, or no colour aesthetic) explicit colours fromscales::hue_pal()are baked in and the plot's scale system is left untouched."inherit"— always mapscolouras an aesthetic (aes(colour = cluster)), unconditionally joining whatever colour scale is present. Useful when you want to force scale sharing; will error if the existing scale is continuous.A palette function that accepts a single integer
nand returnsncolors (e.g.,scales::hue_pal(),rainbow).A single color string — applied to every cluster.
An unnamed character vector of length equal to the number of clusters — colors are assigned to clusters in factor-level order.
A named character vector — names must match cluster levels; order does not matter.
- label
Boolean flag whether the labels should be displayed.
- label.largest
Boolean flag. When
TRUE(default), only the largest part of each cluster is labelled; smaller disconnected parts are drawn but not labelled. WhenFALSE, all parts are labelled. Ignored whenlabel = FALSE.- label.fontsize
Label font size passed to
geom_mark_shape(). Default is10.- label.buffer
Label buffer distance passed to
geom_mark_shape(). Default isunit(0, "cm").- label.fontface
Label font face passed to
geom_mark_shape(). Default is"plain".- label.margin
Label margin passed to
geom_mark_shape(). Default ismargin(2, 2, 2, 2, "pt").- simp_ratio
Fraction of the polygon bounding box area used as the label-placement simplification threshold. Cluster polygons are simplified before the label placement search by removing small concave vertices, which reduces computation while guaranteeing the simplified polygon encloses the original. Larger values simplify more aggressively; set to
0to disable. Default is0.001.
Value
A list of ggplot2 components suitable for adding to a plot with +,
containing a ggplot2::coord_cartesian() specification and a
geom_mark_shape() layer.
Details
The first two columns of maskTable are used as x/y coordinates. Cluster
labels are taken from maskTable$cluster. Shapes are grouped by
maskTable$group.
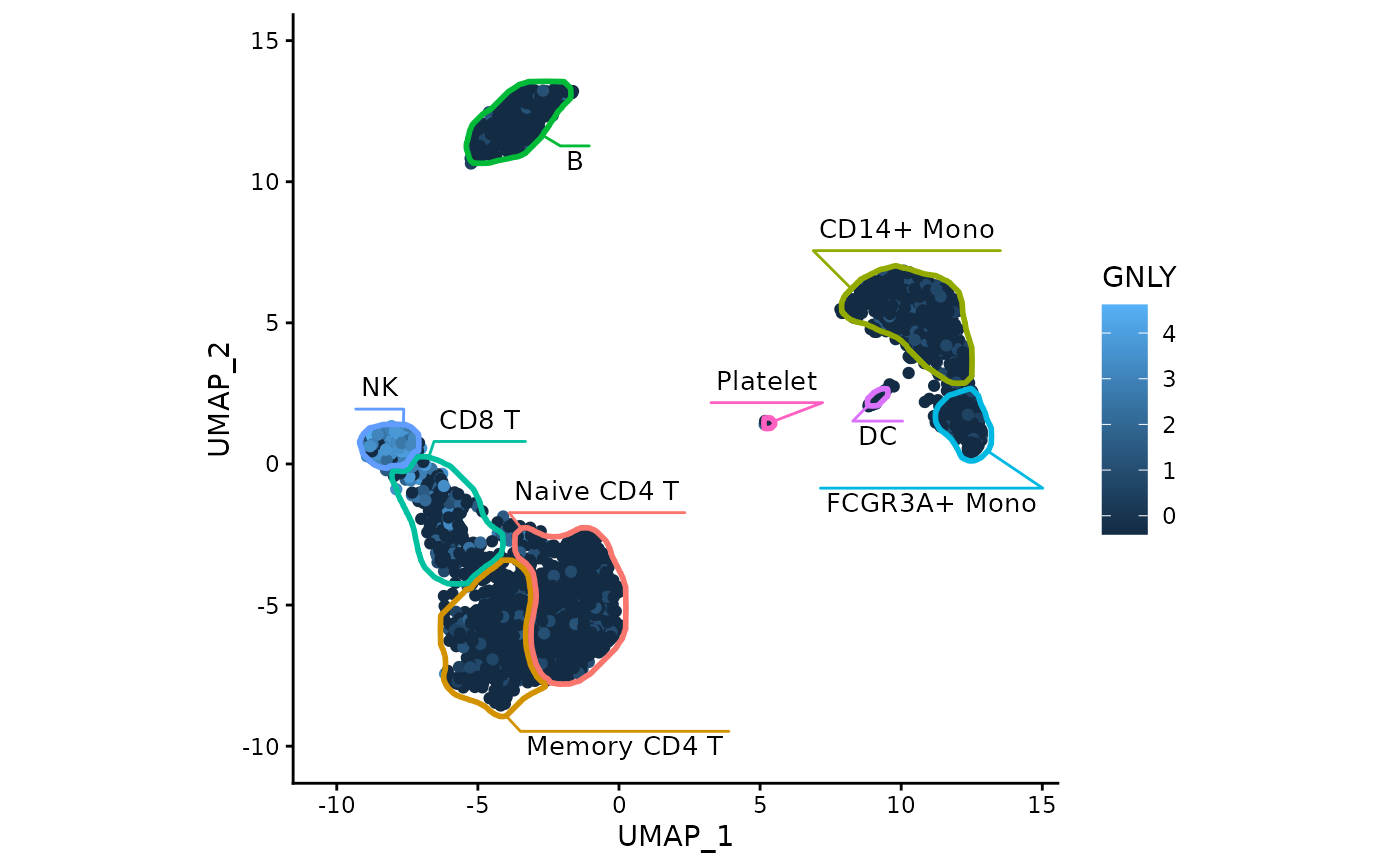
Examples
data("exampleMascarade")
maskTable <- generateMask(dims=exampleMascarade$dims,
                          clusters=exampleMascarade$clusters)
library(ggplot2)
basePlot <- ggplot(do.call(cbind, exampleMascarade)) +
    geom_point(aes(x=UMAP_1, y=UMAP_2, color=GNLY)) +
    scale_color_gradient2(low = "#404040", high="red") +
    theme_classic()

basePlot + fancyMask(maskTable, ratio=1, cols=scales::hue_pal())